Why a Coastline Looks Different on Every Map
Why a coastline looks different on every map: learn how scale, symbols and shoreline definitions shape the view, so you can compare maps with confidence.
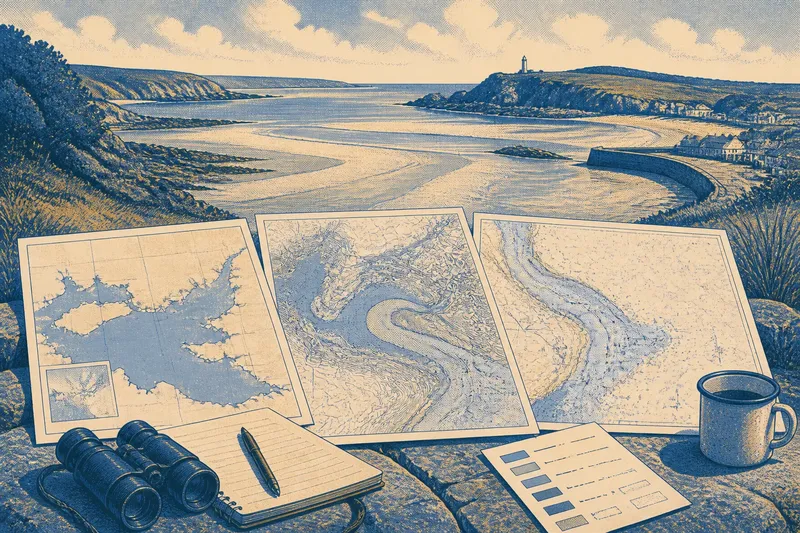
The most common mistake when comparing coastal maps is to treat every wiggly line as the same thing. It can make a broad bay seem to have vanished, or suggest that a beach has shifted, when the real difference is the map’s scale, symbol or chosen shoreline edge. To read a coastline fairly, first ask what each map is trying to show.
A coastline is not a single, sharply fixed boundary in every setting. On a map, it is a selected line drawn from a particular source and simplified to suit a particular purpose. That line may stand for the water’s edge at a stated tide, the boundary between land and water in aerial imagery, or another convention. The coast itself remains a complicated meeting place of water, sediment, rock and built features.
What does the scale change?
Scale determines how much detail can fit on a map. At a small scale, which shows a large area, a cartographer cannot retain every inlet, rock and narrow spit without making the line unreadable. Fine bends are smoothed, tiny indentations disappear, and nearby features may merge into a simpler shape. At a larger scale, a map can show more of those details, though it still has to choose what to include.
This is why a coastal outline on a national atlas may look calm and clean beside the intricate edge on a local chart. Neither is automatically more truthful. The atlas is designed to help readers see regional relationships; a detailed chart may need to distinguish channels, shoals and hazards. Their lines answer different questions.
Scale can also alter the apparent character of a place. A small-scale map may present a headland as a blunt projection, while a close view reveals coves and narrow points along its flanks. When comparing outlines, match the scale as closely as possible. If that is not practical, compare broad features—such as the position of a bay relative to a headland—rather than counting every notch.
Which edge of the shore is being drawn?
“Shoreline” sounds precise, but the water’s edge moves with the tide and can be hard to identify on a gently sloping beach. A map may use a tidal reference line, a visible boundary in an image, a surveyed coastal limit or a convention suited to navigation. On a steep rocky shore, these choices may lie close together. Across a broad tidal flat, they can enclose a substantial strip of ground.
Look for a map’s legend, notes or metadata for terms such as high-water line, low-water line, mean sea level or intertidal zone. These are not interchangeable. A line at low water may trace farther seaward than one at high water; on a flat shore, the difference can make the mapped coast look dramatically wider or narrower. A map that marks the intertidal area as a band may communicate this changing zone better than one thin line.
Built edges add another complication. A seawall, harbour quay or reclaimed waterfront may create a crisp boundary in a map, but it does not necessarily represent the natural limit of the coast. Some maps emphasise the physical edge of land, while others distinguish structures or water areas with separate symbols. Read the legend before deciding what the line means.
How do symbols and colours alter the view?
Cartographic symbols do more than decorate a map. They decide which coastal features catch the eye and which recede. A thick blue line can make an inlet look wider than it is; a pale tint may leave a tidal flat visually joined to the land; a row of small marks may identify rocks without changing the main outline. At a glance, these choices can be mistaken for changes in geography.
Check whether a line is the coastline or a boundary, route, contour or edge of a shaded area. Look at the legend and note how the map treats beaches, marshes, cliffs, dunes and built waterfronts. If one map gives a beach a broad coloured band and another uses only a narrow outline, the difference may come from classification rather than a different survey of the water’s edge.
Colour is especially easy to overread. A pale area beside the sea might represent exposed sand, shallow water, salt marsh or simply a background tint. The legend and map notes settle the question more reliably than visual intuition. For a clear comparison, attend first to the line and its stated meaning, then to the surrounding symbols.
Which map suits the question you have?
There are three useful approaches, each suited to a different kind of comparison:
- Regional overview maps suit readers comparing the broad form of several coasts or locating a bay within a wider landscape. Their simplified outlines make patterns easy to see, but they are a poor choice for judging the exact shape of a small cove.
- Large-scale local maps suit readers studying the arrangement of headlands, inlets, tidal areas and coastal structures in one place. They preserve more detail, though their dense symbols can obscure the overall shape.
- Purpose-built coastal or nautical charts suit readers whose question concerns navigation, water depth, hazards or tidal features. Their conventions are specialised, so the legend and chart notes matter more than a quick visual comparison.
Choose by the decision you need to make, not by which map looks most detailed. For a broad landscape comparison, an overview is often clearer. For a local shoreline feature, use a close-scale map with an explicit description of its coastal line. For water-related interpretation, choose a chart designed for that task and learn its symbols.
How can you compare two coastlines fairly?
Start with a simple sequence: align the mapped area, check scale, read the shoreline definition, then inspect the legend. Compare recognisable anchors such as a river mouth, harbour entrance or headland before judging smaller bends. If the maps use different projections or cover different extents, their shapes may be distorted or framed differently; that is another reason to compare the same location at similar scales.
Imagine you are comparing a regional map with a detailed local map of the same tidal bay. The first shows a smooth curve; the second marks a broad intertidal flat and a narrow inlet. If you check the scales and learn that the detailed map distinguishes the tidal area, the apparent mismatch becomes understandable: the regional outline has simplified the bay, while the local depiction preserves features relevant to that place.
For a more dependable visual check, place the maps side by side rather than tracing one outline over another. Note what each source says about its data and date, where available. The date matters because coasts can change, but it does not explain every difference: a newer image and an older chart may still depict different shoreline conventions.
What questions help explain a mismatch?
Why does a small-scale map have fewer coastal inlets?
Small-scale maps simplify detail so the outline remains legible across a large area. Narrow inlets and tiny coves may be omitted or merged, even when they are visible on a local map.
Does a shoreline line show the water at every tide?
No. A line usually represents a defined reference or mapping convention, not the water’s moving edge throughout the tidal cycle. Check the map notes for the reference used.
Why does a seawall look like the coast on one map?
The map may emphasise the built boundary between land and water, or its scale may leave little room to show the structure separately. A legend may identify seawalls, quays or other artificial edges.
Can two accurate maps show different coastlines?
Yes. They may have different scales, dates, purposes or shoreline definitions. Accuracy is meaningful in relation to the source’s stated method and intended use, not as a promise that every map will draw an identical line.
What is not worth the effort?
It is rarely useful to count tiny bays on maps at different scales, or to assume that a sharper-looking line is inherently more accurate. Nor does a dramatic change in colour necessarily signal a change in the land. Put your effort into the map notes and legend; those small pieces of text often explain more than prolonged visual guessing.
When deciding why a coastline looks different on every map, keep the central distinction in view: a mapped shoreline is an interpretation made for a purpose, not a complete portrait of a restless boundary. Match scale and purpose, identify which edge is being represented, and read the symbols before comparing shape. That gives you a sound basis for seeing both the land and the choices behind its drawn line.